The Drop of Real Liquidity Makes for a Difficult Backdrop for Traders
Institutional Investor recently published an interesting article1 on dropping institutional assets as a percentage of overall global assets under management, hitting very low levels. The trajectory seems to continue to point in that direction and goes along with what is often talked about in this forum―dropping executable institutional volumes. Some of the typical charts are lower on variables that impact cost of trade, but the bottom line is a general drop of real liquidity in the marketplace makes for a difficult backdrop for traders and portfolio managers.
The study in the article cites institutional assets accounting for 31% of all global assets under management in 2021 and a forecasted fall to 26% by 2030, while retail assets continue to be on the rise. Of course, there are mini trends that take place in the equity space, but the more secular market structure shift of volumes from on-exchange to off-exchange has sticking power. Right now, there is a noticeable shift (a mini trend) of lessening retail flows, algo-driven volumes moving to exchange, and signals of more traditional electronic market making taking advantage of the volatility. However, that broader, Covid-influenced shift of higher sustained retail flows, and the manner in which it is executed is a theme that is here to stay.
An important dynamic underlies the move to more retail under management, and that is the move away from defined benefit and pension plans, with employees and employers much more inclined to move to defined contribution plans and 401ks―individuals become responsible for their own retirement savings while capital in the pensions dries up with older assets being paid out. As long as markets are generally rising and the job market is strong, the passive bid the white-collar job market provides to equity markets and the total number of dollars doesn’t shrink.
If we look at flows into the Vanguard Total Stock Market ETF below, we note that the flows continue unabated regardless of the price dips (notably the sharp drop in equity prices in 2020). In fact, the shares outstanding appear to rise when the market falls, hence the continued capital rise and deployment of retail-influenced funds. The resiliency of the passive flow is impressive.
Source: Bloomberg
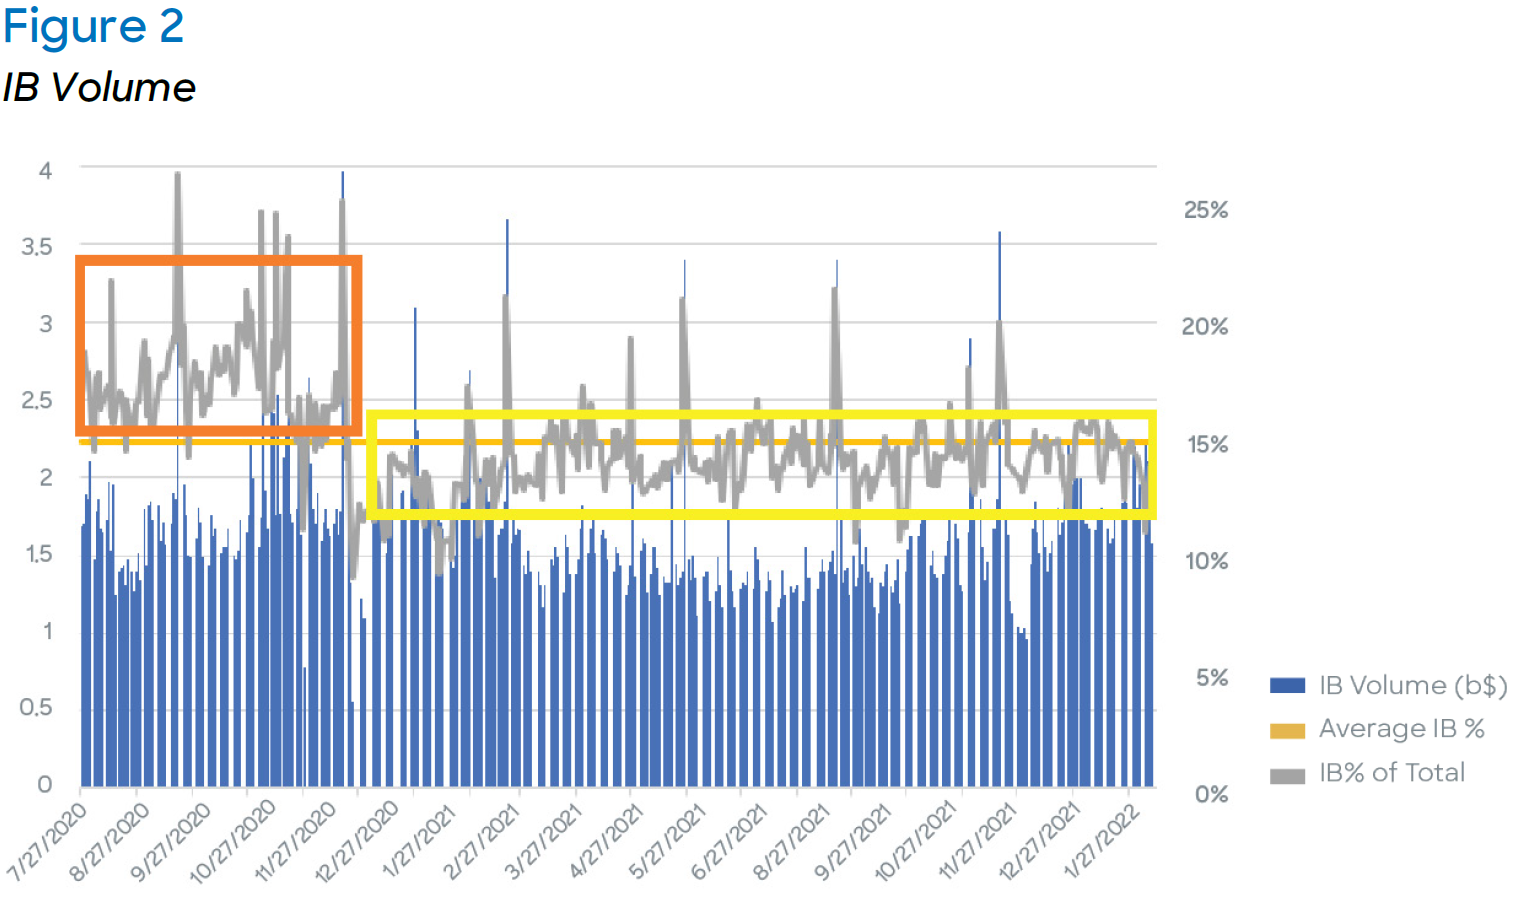
For a long time, sell-side participants have sought the investment banks’ percentage of overall equity volume as a way to measure what is the executable institutional volume in the marketplace. Given that the investment banks execute the vast majority of institutional volume, it can be considered as one component worth monitoring. An even longer-term chart would show that, pre-Covid, this line hovered well north of 20%. And looking at the below, we can see that 2021 was another leg down, and noticeably so.
Source: Chart created by Liquidnet personnel based upon data from Bloomberg
A few weeks weeks ago, the deceleration in market volume was 30%+ from Monday/Tuesday to Thursday/Friday. Barring anomaly-type events such as index rebalances, expiration and month-ends, that extreme of a drawdown doesn’t occur. And now, as some parts of the market reach bear market territory, we should keep in mind that the passive flows keep rolling and the active managers’ “sweet spot” lies in the volatility bands around the trends.Utilizing sentiment readings and looking for divergences and in-trade microstructure flags, and using analytics to course-correct algorithms within the volatility bands and capture alpha is something many traders value and is driving many conversations. The recent move to on-exchange volumes has been mainly driven by quant funds utilizing algos/SORs to get right to the exchange quotes looking to exploit the extremes of volatility trends.
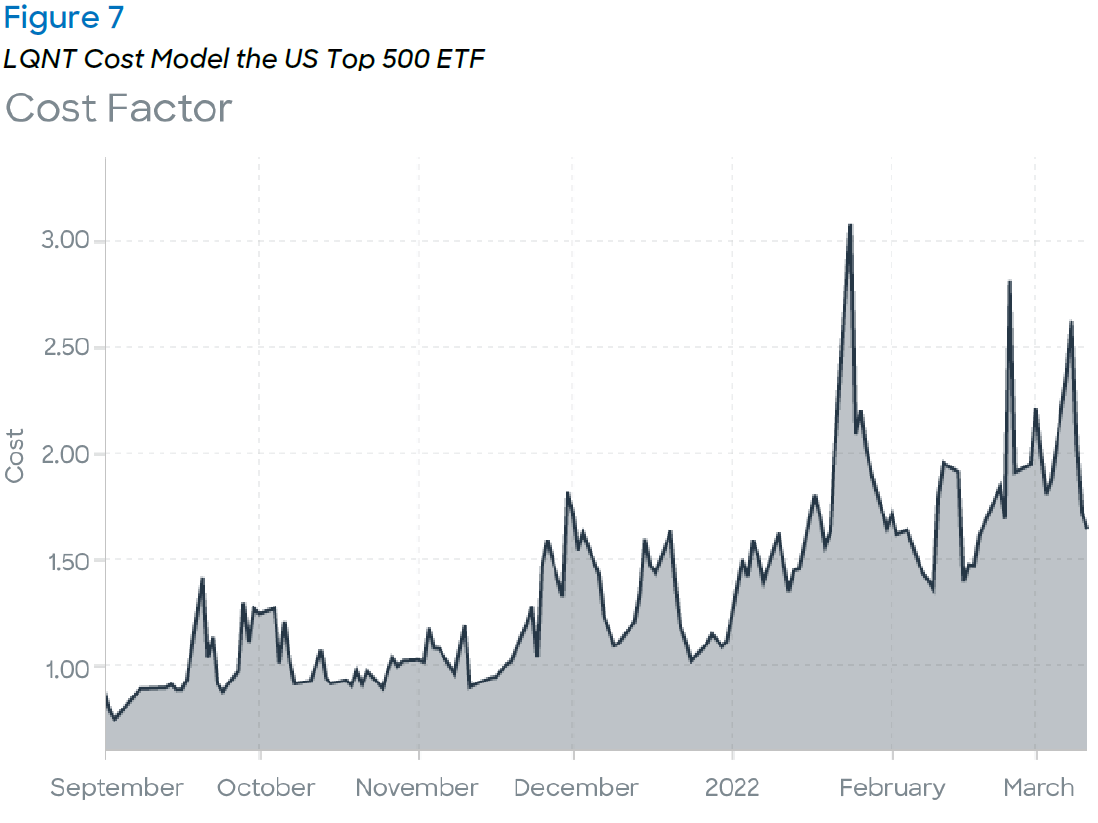
Some interesting charts:
Source: Bloomberg
Source: Bloomberg
Source: Bloomberg
Source: Liquidnet Analytics
Source: Liquidnet Analytics
Source: Bloomberg
Written by Jeffrey O’Connor, Senior Execution Consultant, Market Insight Analyst, US Equities
1 The information provided by Liquidnet is not investment advice nor is it intended as a recommendation to buy, sell or hold any instrument referenced. Any analysis provided is not sufficient upon which to base an investment decision. A recipient should consider its own financial situation and investment objectives and seek independent advice, where appropriate, before making any investment. Although the statements provided by Liquidnet are believed to be correct, they have not been verified and should not be relied upon when considering the merits of any particular investment. All presented data may be subject to slight variations. The information provided by Liquidnet is for institutional investor use and is intended for the recipient only. Any disclosure, reproduction, distribution or other use of the message or any information generated by the product by an individual or entity other than the intended recipients prohibited. Please contact your Liquidnet coverage for more information about any of the information and analysis provided herein.


